Lake Irma Lakewatch Charts
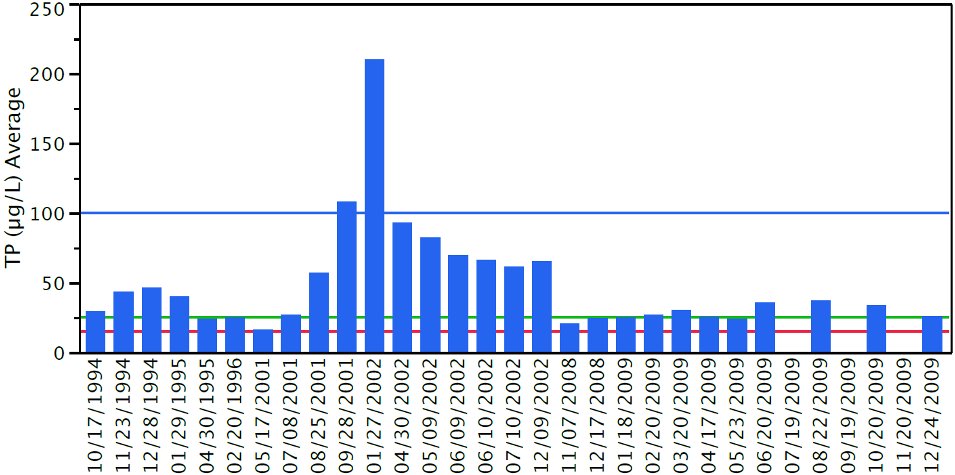
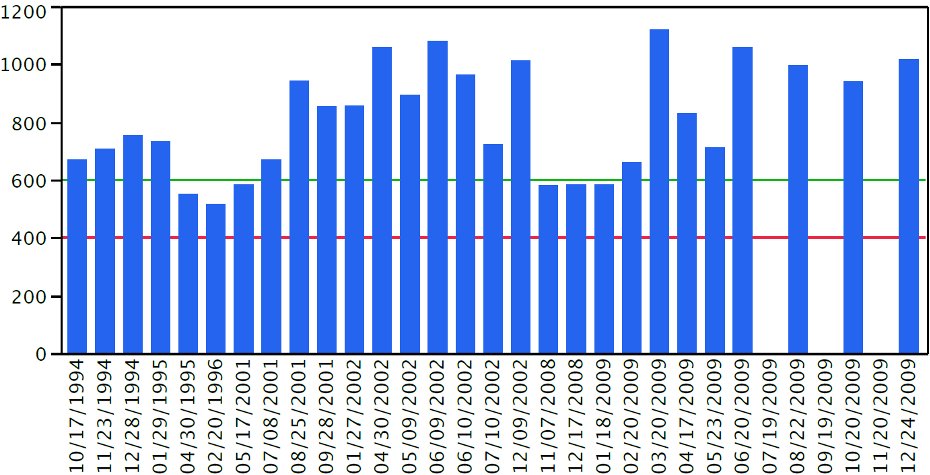
The following charts show the changes in: Total Phosphorous (TP), Total Nitrogen (TN), Total Chlorophyll CHL), and water clarity over the last 14 years.
 |
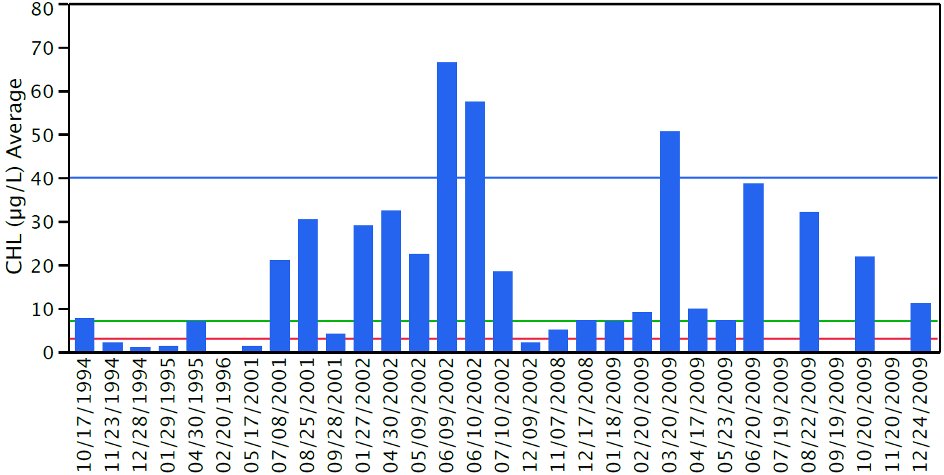 |
| The above chart shows the changes in Total Phosphorous (TP). | The above chart shows the changes in Total Chlorophyll. |
 |
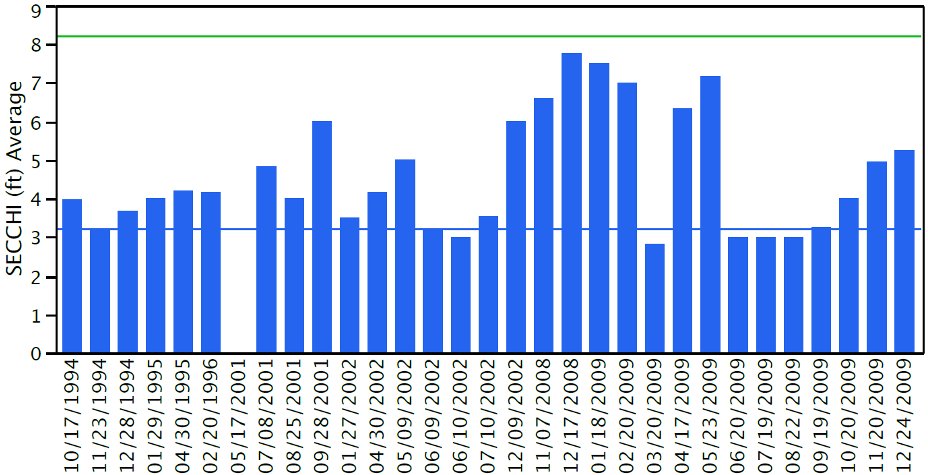 |
| The above chart shows the changes in Total Nitrogen (TN). | The above chart shows the changes in water clarity data. |